plotly.js javascript 图表库
plotly.js 是开源的 JavaScript 图表库,它基于 D3.js 和 stack.gl 。是一个高层次的、描述性的图表库。 plotly.js 带来20种图表类型,包括 3D 图表,统计图表,和 SVG 地图。
实例代码:
Plotly.d3.csv('HTTPS://raw.Githubusercontent.com/plotly/Datasets/master/gapminderDataFiveYear.csv', Function(err, rows){ var YEAR = 2007; var continents = ['Asia', 'Europe', 'Africa', 'OceaNia', 'Americas']; var POP_TO_PX_SIZE = 2e5; function unpack(rows, key) { return rows.map(function(row) { return row[key]; });
} var data = continents.map(function(continent) { var rowsFiltered = rows.filter(function(row) { return (row.continent === continent) && (+row.year === YEAR);
}); return {
mode: 'markers',
name: continent,
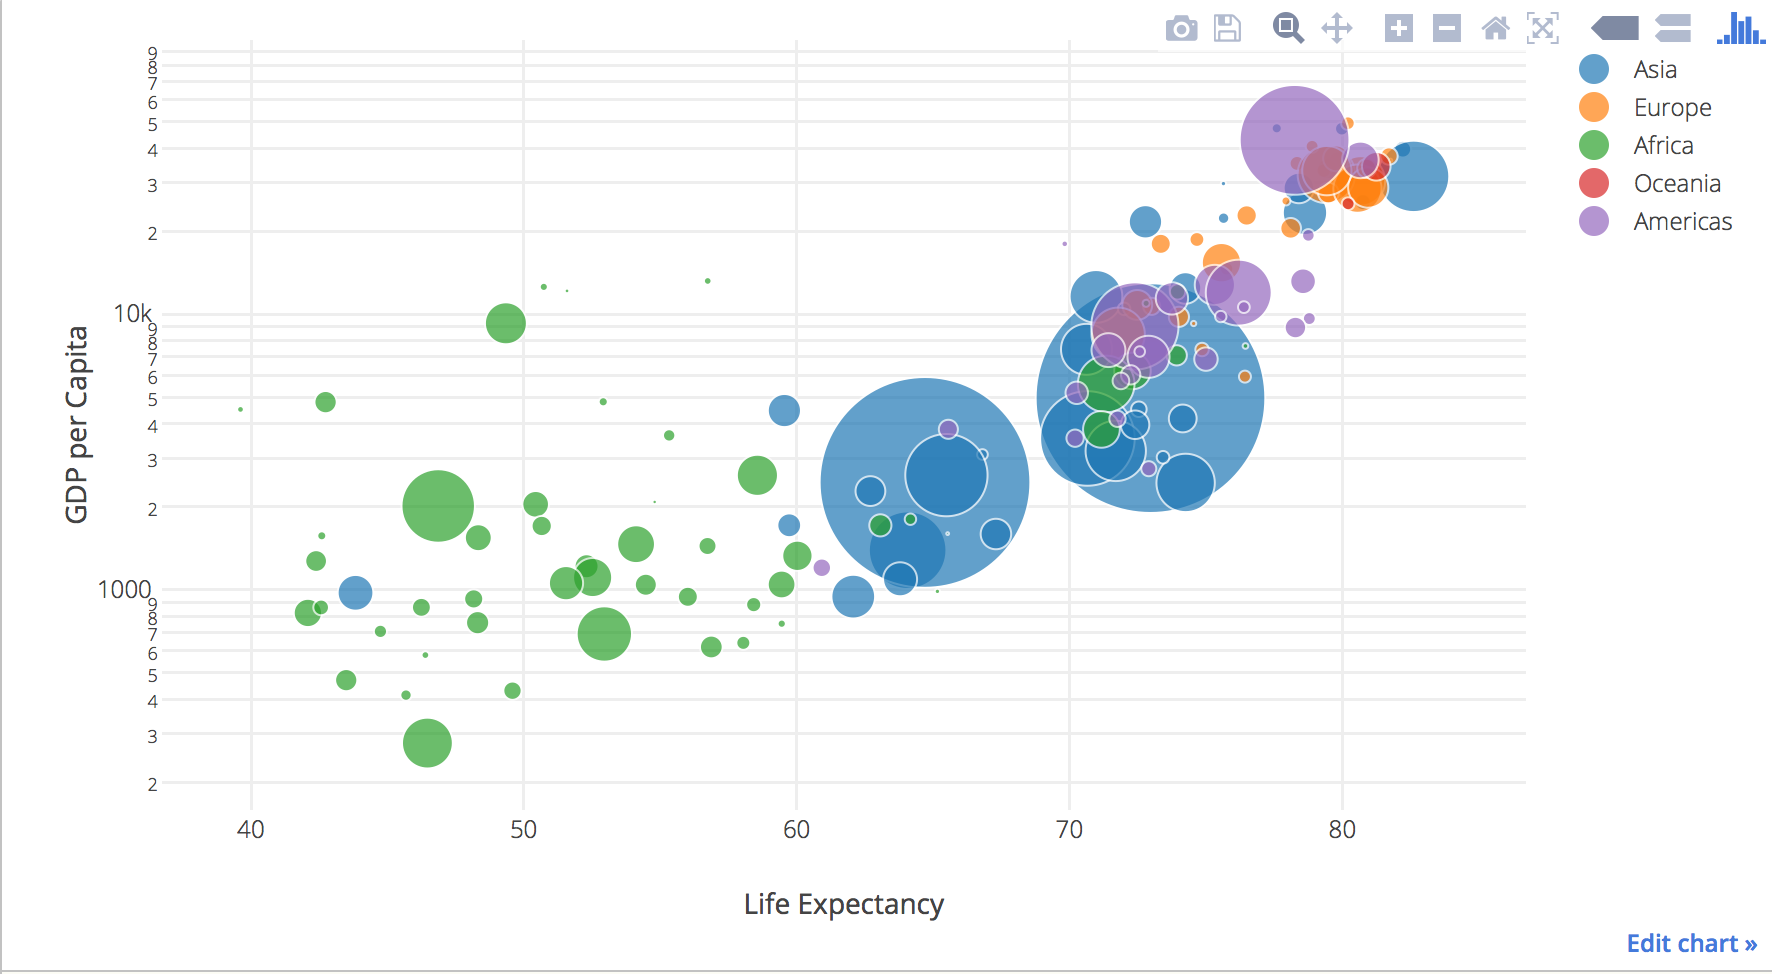
x: unpack(rowsFiltered, 'lifeExp'),
y: unpack(rowsFiltered, 'GDpPercap'),
text: unpack(rowsFiltered, 'country'),
marker: {
sizemode: 'area',
size: unpack(rowsFiltered, 'pop'),
sizeref: POP_TO_PX_SIZE
}
};
}); var layout = {
xaxis: {title: 'Life Expectancy'},
yaxis: {title: 'GDP per Capita', type: 'log'},
margin: {t: 20},
hovermode: 'closest'
};
Plotly.plot('my-graph', data, layout, {showLink: false});
});
- 数据可视化平台 Plotly 开源强大的 JS 图表库
-
数据可视化平台 Plotly 开源旗下强大的 JavaScript 图表库,支持三种不同类型的图表,包括地图,箱形图和密度图,以及更常见的产品如,条状和线形图。源代码已发布在 GitHub。(已收录开源中国软件库 plotly.js)最新版本的 Plotly.js 可以免费、无限制地用于任何项目。此前 Plotly 在 R, Python 和 MATLAB 的客户端一直是
发布于 2015-11-20 23:01:47 | 928 次阅读
最新资讯
月排行榜