Echarts图表在实际项目中的应用说明
发布于 2016-01-10 06:57:44 | 438 次阅读 | 评论: 0 | 来源: PHPERZ
ECharts Javascript免费图表库
ECharts开源来自百度商业前端数据可视化团队,基于html5 Canvas,是一个纯Javascript图表库,提供直观,生动,可交互,可个性化定制的数据可视化图表。创新的拖拽重计算、数据视图、值域漫游等特性大大增强了用户体验,赋予了用户对数据进行挖掘、整合的能力。
效果:


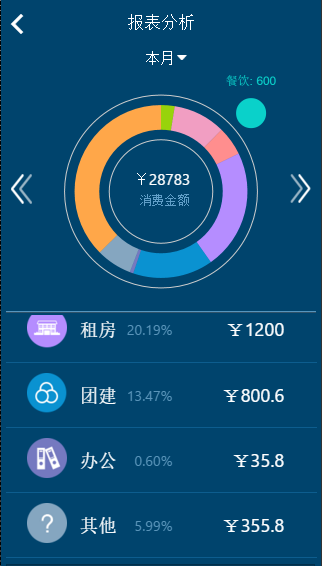


功能:点击主页进去会有不同的图表展现,点击两侧会有展示不同的数据以及图表。图表也可以托拉拽,重组、归为。
下面看下主要的代码:
数据来源:此时还没有连接接口
$scope.getData = [];//获取到的数据
if(flag == "thisMonth"){
  $scope.chartsTitle = "本月";
  index = 0;
  $scope.getData = [
    {imgSrc:"img/keepAccounts/food.png",name:"餐饮",percentage:"10.10%",value:"600"},
    {imgSrc:"img/keepAccounts/call.png",name:"通讯",percentage:"2.29%",value:"136.2"},
    {imgSrc:"img/keepAccounts/hotel.png",name:"酒店",percentage:"8.80%",value:"523"},
    {imgSrc:"img/keepAccounts/traffic.png",name:"交通",percentage:"4.88%",value:"290"},
    {imgSrc:"img/keepAccounts/rent.png",name:"租房",percentage:"20.19%",value:"1200"},
    {imgSrc:"img/keepAccounts/teamBuilding.png",name:"团建",percentage:"13.47%",value:"800.6"},
    {imgSrc:"img/keepAccounts/office.png",name:"办公",percentage:"0.60%",value:"35.8"},
    {imgSrc:"img/keepAccounts/others.png",name:"其他",percentage:"5.99%",value:"355.8"},
    {imgSrc:"img/keepAccounts/travel.png",name:"旅行",percentage:"33.68%",value:"2002"}
  ];
}else if(flag == "waitCommit"){
  index = 1;
  $scope.getData = [
    {imgSrc:"img/keepAccounts/food.png",name:"餐饮",percentage:"38.12%",value:"365"},
    {imgSrc:"img/keepAccounts/call.png",name:"通讯",percentage:"11.09%",value:"106.2"},
    {imgSrc:"img/keepAccounts/hotel.png",name:"酒店",percentage:"28.09%",value:"269"},
    {imgSrc:"img/keepAccounts/traffic.png",name:"交通",percentage:"1.60%",value:"15.3"},
    {imgSrc:"img/keepAccounts/travel.png",name:"旅行",percentage:"21.10%",value:"202"}
  ];
  $scope.chartsTitle = "待提交";
}else if(flag == "checked"){
  index = 2;
  $scope.chartsTitle = "已审批";
  $scope.getData = [
    {imgSrc:"img/keepAccounts/food.png",name:"餐饮",percentage:"29.79%",value:"35"},
    {imgSrc:"img/keepAccounts/call.png",name:"通讯",percentage:"13.79%",value:"16.2"},
    {imgSrc:"img/keepAccounts/hotel.png",name:"酒店",percentage:"24.68%",value:"29"},
    {imgSrc:"img/keepAccounts/traffic.png",name:"交通",percentage:"13.02%",value:"15.3"},
    {imgSrc:"img/keepAccounts/travel.png",name:"旅行",percentage:"18.72%",value:"22"}
  ];
}
因为有三个入口跳入会展示不同的数据,所以这里有个if判断,index是为了点击左右两侧按钮跳转展示不同页面的数据的。
表格的配置:
//路径配置
require.config({
  paths:{
    echarts:'./js/dist'
  }
});
//图表使用
function drawCharts (dataArr,colorArr){
  require(
    [
      'echarts',
      'echarts/chart/pie'
    ],
    function (ec,data) {
      var myChart = ec.init(document.getElementById('chartsDiv'), 'macarons');
      var option = {
        tooltip : {
          trigger: 'item',
          formatter: "{a} <br/>{b} : {c} ({d}%)"
        },
        calculable : true,
        series : [
          {
            name:'消费金额',
            type:'pie',
            radius : ['50%', '70%'],
            itemStyle : {
              normal : {
                label : {
                  show : false
                },
                labelLine : {
                  show : false
                }
              },
              emphasis : {
                label : {
                  show : true,
                  position : 'center',
                  textStyle : {
                    fontSize : '30',
                    fontWeight : 'bold'
                  }
                }
              }
            },
            data:[

            ]
          }
        ],
        color:[
        ]
      };
      option.series[0].data = dataArr;
      option.color = colorArr;
      myChart.setOption(option);
    }
  );
}
这里面图表的颜色和图表的数据要设置下:
//图表的数据和颜色
function setData (data){
  chartsData = [];
  chartsColor = [];
  for(var i = 0;i<data.length;i++){
    var templateData = {};
    templateData.value = data[i].value;
    templateData.name = data[i].name;
    $scope.costMoney+=parseInt(data[i].value);
    chartsData.push(templateData);
    if(data[i].name == "通讯"){
      chartsColor[i] = "#98D30B";
    }else if(data[i].name == "团建"){
      chartsColor[i] = "#0A92D1";
    }else if(data[i].name == "餐饮"){
      chartsColor[i] = "#0AD1CA";
    }else if(data[i].name == "办公"){
      chartsColor[i] = "#7579C0";
    }else if(data[i].name == "租房"){
      chartsColor[i] = "#B58DFF";
    }else if(data[i].name == "交通"){
      chartsColor[i] = "#FF8E8E";
    }else if(data[i].name == "旅行"){
      chartsColor[i] = "#FFA749";
    }else if(data[i].name == "酒店"){
      chartsColor[i] = "#F19EC2";
    }else if(data[i].name == "其他"){
      chartsColor[i] = "#85A6C0";
    }
  }
}
然后在页面加载进来的时候需要调用这些函数:
$scope.$on('$ionicView.enter',function(){
  //设置表格div高度
  $(".chartsDiv").css('height',$(".chartsRow").outerHeight());
  $(".centerDiv").css('left',window.innerWidth/2-$(".centerDiv").outerHeight()/2-7);
  $(".chartsRow").css("margin-top",$(".dateTime").outerHeight());
  setData($scope.getData);
  drawCharts(chartsData,chartsColor);
});
注意这里的$ionicView.enter
因为要设置抽屉效果的div的高度
点击两侧按钮,显示别的页面的不同的数据需要重新加载下这个过程
封装的方法如下:
/点击左边右边按钮重新加载数据
function reload(item){
  if(item == 0){
    $scope.chartsTitle = "本月";
    $scope.getData = [
      {imgSrc:"img/keepAccounts/food.png",name:"餐饮",percentage:"10.10%",value:"600"},
      {imgSrc:"img/keepAccounts/call.png",name:"通讯",percentage:"2.29%",value:"136.2"},
      {imgSrc:"img/keepAccounts/hotel.png",name:"酒店",percentage:"8.80%",value:"523"},
      {imgSrc:"img/keepAccounts/traffic.png",name:"交通",percentage:"4.88%",value:"290"},
      {imgSrc:"img/keepAccounts/rent.png",name:"租房",percentage:"20.19%",value:"1200"},
      {imgSrc:"img/keepAccounts/teamBuilding.png",name:"团建",percentage:"13.47%",value:"800.6"},
      {imgSrc:"img/keepAccounts/office.png",name:"办公",percentage:"0.60%",value:"35.8"},
      {imgSrc:"img/keepAccounts/others.png",name:"其他",percentage:"5.99%",value:"355.8"},
      {imgSrc:"img/keepAccounts/travel.png",name:"旅行",percentage:"33.68%",value:"2002"}
    ];
  }else if(item == 1){
    $scope.chartsTitle = "待提交";
    $scope.getData = [
      {imgSrc:"img/keepAccounts/hotel.png",name:"酒店",percentage:"28.09%",value:"269"},
      {imgSrc:"img/keepAccounts/call.png",name:"通讯",percentage:"11.09%",value:"106.2"},
      {imgSrc:"img/keepAccounts/traffic.png",name:"交通",percentage:"1.60%",value:"15.3"},
      {imgSrc:"img/keepAccounts/food.png",name:"餐饮",percentage:"38.12%",value:"365"},
      {imgSrc:"img/keepAccounts/travel.png",name:"旅行",percentage:"21.10%",value:"202"}
    ];
  }else if(item == 2){
    $scope.chartsTitle = "已审批";
    $scope.getData = [
      {imgSrc:"img/keepAccounts/call.png",name:"通讯",percentage:"13.79%",value:"16.2"},
      {imgSrc:"img/keepAccounts/hotel.png",name:"酒店",percentage:"24.68%",value:"29"},
      {imgSrc:"img/keepAccounts/traffic.png",name:"交通",percentage:"13.02%",value:"15.3"},
      {imgSrc:"img/keepAccounts/food.png",name:"餐饮",percentage:"29.79%",value:"35"},
      {imgSrc:"img/keepAccounts/travel.png",name:"旅行",percentage:"18.72%",value:"22"}
    ];
  }
  setData($scope.getData);
  drawCharts(chartsData,chartsColor);
}
然后点击方法里直接调用,就出现了所有的效果
$scope.lastPage = function(){
  index-=1;
  thisIndex = Math.abs(index%3);
  reload(thisIndex);
};
$scope.nextPage = function(){
  index+=1;
  thisIndex = Math.abs(index%3);
  reload(thisIndex);
};
这里注意方法的封装,代码的复用。
推荐阅读
最新资讯