Linux监控软件Nagios安装与配置
发布于 2016-01-10 10:18:37 | 446 次阅读 | 评论: 0 | 来源: PHPERZ
Nagios Linux平台下网络监视工具
Nagios是一款开源的免费网络监视工具,能有效监控Windows、Linux和Unix的主机状态,交换机路由器等网络设置,打印机等。在系统或服务状态异常时发出邮件或短信报警第一时间通知网站运维人员,在状态恢复后发出正常的邮件或短信通知。
一、安装扩展源
[root@www ~]# rpm -ivh http://mirrors.yun-idc.com/epel/6/i386/epel-release-6-8.noarch.rpm
二、安装Nagios相关软件包
[root@www ~]# yum -y install httpd nagios nagios-plugins nagios-plugins-all nrpe nagios-plugins-nrpe
三、设置nagios后台登录用户名和密码
[root@www ~]# htpasswd -c /etc/nagios/passwd nagiosadmin  #这里指定用户名为nagiosadmin,而不是其他
New password:
Re-type new password:
Adding password for user nagiosadmin
四、检查Nagios配置
[root@www ~]# nagios -v /etc/nagios/nagios.cfg

Nagios Core 3.5.1
Copyright (c) 2009-2011 Nagios Core Development Team and Community Contributors
Copyright (c) 1999-2009 Ethan Galstad
Last Modified: 08-30-2013
License: GPL

Website: http://www.nagios.org
Reading configuration data...
   Read main config file okay...
Processing object config file '/etc/nagios/objects/commands.cfg'...
Processing object config file '/etc/nagios/objects/contacts.cfg'...
Processing object config file '/etc/nagios/objects/timeperiods.cfg'...
Processing object config file '/etc/nagios/objects/templates.cfg'...
Processing object config file '/etc/nagios/objects/localhost.cfg'...
Processing object config directory '/etc/nagios/conf.d'...
   Read object config files okay...

Running pre-flight check on configuration data...

Checking services...
	Checked 8 services.
Checking hosts...
	Checked 1 hosts.
Checking host groups...
	Checked 1 host groups.
Checking service groups...
	Checked 0 service groups.
Checking contacts...
	Checked 1 contacts.
Checking contact groups...
	Checked 1 contact groups.
Checking service escalations...
	Checked 0 service escalations.
Checking service dependencies...
	Checked 0 service dependencies.
Checking host escalations...
	Checked 0 host escalations.
Checking host dependencies...
	Checked 0 host dependencies.
Checking commands...
	Checked 24 commands.
Checking time periods...
	Checked 5 time periods.
Checking for circular paths between hosts...
Checking for circular host and service dependencies...
Checking global event handlers...
Checking obsessive compulsive processor commands...
Checking misc settings...

Total Warnings: 0
Total Errors:   0

Things look okay - No serious problems were detected during the pre-flight check
五、启动Nagios和http服务
[root@www ~]# /etc/init.d/httpd start
Starting httpd:                                            [  OK  ]
[root@www ~]# /etc/init.d/nagios start
Starting nagios: done.
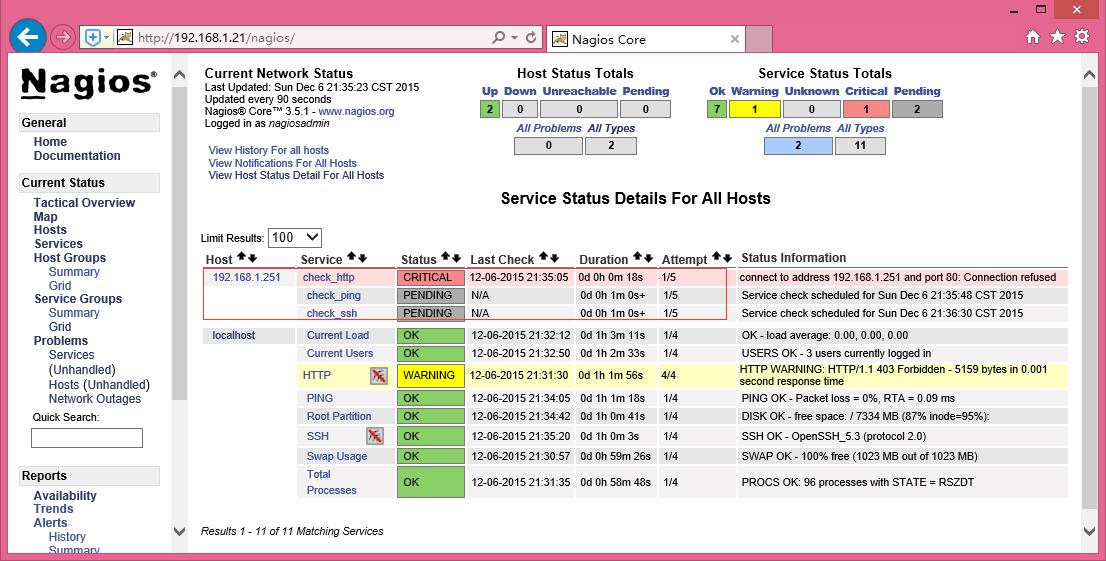
六、浏览器访问


七、Nagios添加被监控客户端主机
1、安装Nagios服务
[root@sh ~]# rpm -ivh epel-release-6-8.noarch.rpm
[root@sh ~]# yum -y install nagios-plugins nagios-plugins-all nrpe nagios-plugins-nrpe
2、修改/etc/nagios/nrpe.cfg文件
[root@sh ~]# vim /etc/nagios/nrpe.cfg
 81 allowed_hosts=127.0.0.1,192.168.1.21 #添加nagios服务端IP
 97 dont_blame_nrpe=1   #0改为1
3、启动nrpe
[root@sh ~]# /etc/init.d/nrpe start
Starting nrpe:                                             [  OK  ]
4、Nagios服务端添加被监控客户端主机
[root@www ~]# cd /etc/nagios/conf.d/
[root@www conf.d]# ls
[root@www conf.d]# vim 192.168.1.251.cfg
define host{
        use                     linux-server
        host_name           192.168.1.251
        alias                       1.251
        address                 192.168.1.251
        }

define service{
        use                     generic-service
        host_name               192.168.1.251
        service_description     check_ping
        check_command           check_ping!100.0,20%!200.0,50%
        max_check_attempts 5
        normal_check_interval 1
}

define service{
        use                     generic-service
        host_name               192.168.1.251
        service_description     check_ssh
        check_command           check_ssh
        max_check_attempts      5  #当nagios检测到问题时,一共尝试检测5次都有问题才会告警,如果该数值为1,那么检测到问题立即告警
        normal_check_interval   1  #重新检测的时间间隔,单位是分钟,默认是3分钟
        notification_interval   60 #在服务出现异常后,故障一直没有解决,nagios再次对使用者发出通知的时间。如果你认为,所有的事件只需要一次通知就够了,可以把这里的选项设为0
}

define service{
        use                     generic-service
        host_name               192.168.1.251
        service_description     check_http
        check_command           check_http
        max_check_attempts      5
        normal_check_interval 1
}
5、检查配置
[root@www conf.d]# nagios -v /etc/nagios/nagios.cfg
6、重启nagios
[root@www conf.d]# /etc/init.d/nagios restart
Running configuration check...done.
Stopping nagios: done.
Starting nagios: done.
7、查看效果
八、添加nrpe支持的监控服务
1、添加nrpe服务
[root@www ~]# vim /etc/nagios/objects/commands.cfg
################################################################################


# 'notify-host-by-email' command definition
define command{
        command_name    notify-host-by-email
        command_line    /usr/bin/printf "%b" "***** Nagios *****\n\nNotification Type: $NOTIFICATIONTYPE$\nHost: $HO
STNAME$\nState: $HOSTSTATE$\nAddress: $HOSTADDRESS$\nInfo: $HOSTOUTPUT$\n\nDate/Time: $LONGDATETIME$\n" | /bin/mail
-s "** $NOTIFICATIONTYPE$ Host Alert: $HOSTNAME$ is $HOSTSTATE$ **" $CONTACTEMAIL$
        }

# 'notify-service-by-email' command definition
define command{
        command_name    notify-service-by-email
        command_line    /usr/bin/printf "%b" "***** Nagios *****\n\nNotification Type: $NOTIFICATIONTYPE$\n\nService
: $SERVICEDESC$\nHost: $HOSTALIAS$\nAddress: $HOSTADDRESS$\nState: $SERVICESTATE$\n\nDate/Time: $LONGDATETIME$\n\nAd
ditional Info:\n\n$SERVICEOUTPUT$\n" | /bin/mail -s "** $NOTIFICATIONTYPE$ Service Alert: $HOSTALIAS$/$SERVICEDESC$
is $SERVICESTATE$ **" $CONTACTEMAIL$
        }

define command{
        command_name    check_nrpe  #自定义check
        command_line    $USER1$/check_nrpe -H $HOSTADDRESS$ -c $ARG1$
        }


################################################################################
2、添加nrpe服务脚本
[root@www ~]# vim /etc/nagios/conf.d/192.168.1.251.cfg
......
#check_nrpe
define service{
        use     generic-service
        host_name       192.168.1.251
        service_description     check_load  #监控负载
        check_command           check_nrpe!check_load
        max_check_attempts 5
        normal_check_interval 1
}
define service{
        use     generic-service
        host_name       192.168.1.251
        service_description     check_disk_sda1
        check_command           check_nrpe!check_hda1  #check_nrpe为前面自定义的模块名称,check_hda1为被监控主机/etc/nagios/nrpe.cfg文件里定义的脚本名称
        max_check_attempts 5
        normal_check_interval 1
}
#define service{    #可以添加多块磁盘监控
#        use     generic-service
#        host_name       192.168.1.251
#        service_description     check_disk_hda2
#        check_command           check_nrpe!check_hda2
#        max_check_attempts 5
#        normal_check_interval 1
#}
[root@www ~]# nagios -v /etc/nagios/nagios.cfg
.......
Total Warnings: 0
Total Errors:   0
Things look okay - No serious problems were detected during the pre-flight check
3、被监控主机通过nrpe.cfg文件定义的脚本命令
[root@sh ~]# vim /etc/nagios/nrpe.cfg
# The following examples use hardcoded command arguments...

command[check_users]=/usr/lib64/nagios/plugins/check_users -w 5 -c 10
command[check_load]=/usr/lib64/nagios/plugins/check_load -w 15,10,5 -c 30,25,20
command[check_hda1]=/usr/lib64/nagios/plugins/check_disk -w 20% -c 10% -p /dev/sda1
#command[check_hda2]=/usr/lib64/nagios/plugins/check_disk -w 20% -c 10% -p /dev/hda2
command[check_zombie_procs]=/usr/lib64/nagios/plugins/check_procs -w 5 -c 10 -s Z
command[check_total_procs]=/usr/lib64/nagios/plugins/check_procs -w 150 -c 200
4、重启服务
[root@www ~]# /etc/init.d/nagios restart
Running configuration check...done.
Stopping nagios: done.
Starting nagios: done.
[root@sh ~]# /etc/init.d/nrpe restart
Shutting down nrpe:                                        [  OK  ]
Starting nrpe:                                             [  OK  ]
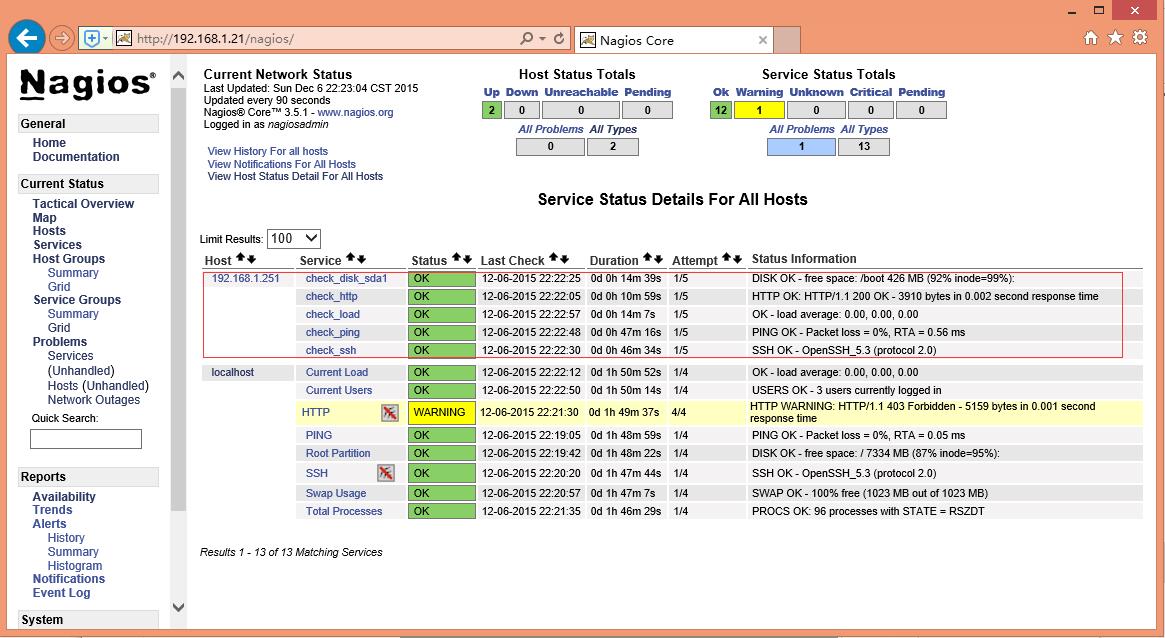
5、web页面查看结果
6、查看nagios日志文件
[root@www ~]# ls /var/log/nagios/
archives  nagios.log  objects.cache  retention.dat  spool  status.dat
[root@www ~]# cat /var/log/nagios/nagios.log
[1449405095] Nagios 3.5.1 starting... (PID=1319)
[1449405095] Local time is Sun Dec 06 20:31:35 CST 2015
[1449405095] LOG VERSION: 2.0
[1449405095] Finished daemonizing... (New PID=1320)
[1449405217] SERVICE ALERT: localhost;HTTP;WARNING;SOFT;1;HTTP WARNING: HTTP/1.1 403 Forbidden - 5159 bytes in 0.001 second response time
[1449405277] SERVICE ALERT: localhost;HTTP;WARNING;SOFT;2;HTTP WARNING: HTTP/1.1 403 Forbidden - 5159 bytes in 0.001 second response time
[1449405337] SERVICE ALERT: localhost;HTTP;WARNING;SOFT;3;HTTP WARNING: HTTP/1.1 403 Forbidden - 5159 bytes in 0.001 second response time
[1449405397] SERVICE ALERT: localhost;HTTP;WARNING;HARD;4;HTTP WARNING: HTTP/1.1 403 Forbidden - 5159 bytes in 0.001 second response time
[1449405683] Caught SIGTERM, shutting down...
[1449405683] Successfully shutdown... (PID=1320)
[1449405684] Nagios 3.5.1 starting... (PID=1474)
[1449405684] Local time is Sun Dec 06 20:41:24 CST 2015
[1449405684] LOG VERSION: 2.0
[1449405684] Finished daemonizing... (New PID=1475)
[1449408863] Caught SIGTERM, shutting down...
[1449408863] Successfully shutdown... (PID=1475)
[1449408863] Nagios 3.5.1 starting... (PID=1833)
[1449408863] Local time is Sun Dec 06 21:34:23 CST 2015
[1449408863] LOG VERSION: 2.0
[1449408863] Finished daemonizing... (New PID=1834)
[1449408913] SERVICE ALERT: 192.168.1.251;check_http;CRITICAL;SOFT;1;connect to address 192.168.1.251 and port 80: Connection refused
[1449409033] SERVICE ALERT: 192.168.1.251;check_http;CRITICAL;SOFT;2;connect to address 192.168.1.251 and port 80: Connection refused
[1449409153] SERVICE ALERT: 192.168.1.251;check_http;CRITICAL;SOFT;3;connect to address 192.168.1.251 and port 80: Connection refused
[1449409273] SERVICE ALERT: 192.168.1.251;check_http;CRITICAL;SOFT;4;connect to address 192.168.1.251 and port 80: Connection refused
[1449409393] SERVICE ALERT: 192.168.1.251;check_http;CRITICAL;HARD;5;connect to address 192.168.1.251 and port 80: Connection refused
[1449409393] SERVICE NOTIFICATION: nagiosadmin;192.168.1.251;check_http;CRITICAL;notify-service-by-email;connect to address 192.168.1.251 and port 80: Connection refused
[1449410874] Caught SIGTERM, shutting down...
[1449410874] Successfully shutdown... (PID=1834)
[1449410874] Nagios 3.5.1 starting... (PID=2330)
[1449410874] Local time is Sun Dec 06 22:07:54 CST 2015
[1449410874] LOG VERSION: 2.0
[1449410874] Finished daemonizing... (New PID=2331)
[1449411134] SERVICE ALERT: 192.168.1.251;check_http;OK;HARD;5;HTTP OK: HTTP/1.1 200 OK - 3910 bytes in 0.001 second response time
[1449411134] SERVICE NOTIFICATION: nagiosadmin;192.168.1.251;check_http;OK;notify-service-by-email;HTTP OK: HTTP/1.1 200 OK - 3910 bytes in 0.001 second response time
[1449411714] Caught SIGTERM, shutting down...
[1449411714] Successfully shutdown... (PID=2331)
[1449411714] Nagios 3.5.1 starting... (PID=2614)
[1449411714] Local time is Sun Dec 06 22:21:54 CST 2015
[1449411714] LOG VERSION: 2.0
[1449411714] Finished daemonizing... (New PID=2615)
九、Nagios配置邮件警告
1、增加define contact和define contactgroup配置
[root@www ~]# vim /etc/nagios/objects/contacts.cfg

# We only have one contact in this simple configuration file, so there is
# no need to create more than one contact group.

define contactgroup{
        contactgroup_name       admins
        alias                   Nagios Administrators
        members                 nagiosadmin
        }

# add mail addressee
define contact{
        contact_name               admin
        use                             generic-contact
        alias                           administrator
        email              741616710@qq.com
        }

define contact{
        contact_name               ming
        use                             generic-contact
        alias                            HM
        email              root@huangmingming.cn
        }

define contactgroup{
        contactgroup_name          common
        alias                            common
        members                          admin,ming
        }
2、修改define service,增加相应配置
[root@www ~]# vim /etc/nagios/conf.d/192.168.1.251.cfg
define service{
use generic-service
host_name 192.168.1.251
service_description check_http
check_command check_http
max_check_attempts 5
normal_check_interval 1
contact_groups common
notifications_enabled 1
notification_period 24x7
notification_options w,u,c,r
}
[root@www ~]# nagios -v /etc/nagios/nagios.cfg