JavaMelody v1.53.0 发布,系统监控工具
发布于 2014-10-02 22:53:51 | 280 次阅读 | 评论: 0 | 来源: 网友投递
JavaMelody 系统监控工具
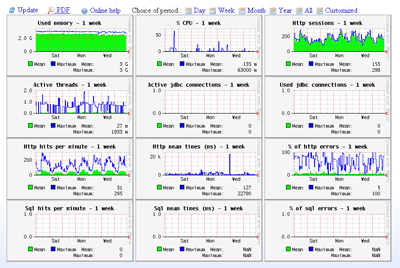
JavaMelody是一个系统监控工具 , 能够监测Java或Java EE应用程序服务器,并以图表的方式显示:Java内存和Java CPU使用情况,用户Session数量,JDBC连接数,和http请求、sql请求、jsp页面与业务接口方法(EJB3、Spring、 Guice)的执行数量,平均执行时间,错误百分比等。图表可以按天,周,月,年或自定义时间段查看。
JavaMelody v1.53.0 发布,此版本现已提供下载。
其他下载:
-
Maven 用户,在 webapp 下的 pom.xml 添加一个dependency:
        <dependency>
                <groupId>net.bull.javamelody</groupId>
                <artifactId>javamelody-core</artifactId>
                <version>1.53.0</version>
        </dependency>
更新内容如下:
-
fix: XSS vulnerability in the reports
-
fix: in v1.52.0 with Tomcat, graphs of bytes received/sent and of Tomcat active threads were not displayed anymore in "Other charts" (revision 3908). This was unfortunately caused by the fix of issue 406 .
-
fix issue 342 : In JIRA logs since JIRA v6.0.8, "RuntimeException converting item 'net.bull.javamelody:net.bull.javamelody.jira-web-item' to Simple link"
-
fix issue 439 : Display Linux version in "System informations", and not "Linux unknown"
-
improved: Portuguese translation (revision 3885, thanks to Fernando Boaglio)
-
added: new parameter "sampling-included-packages" for a white list in cpu hotspots, instead of using the "sampling-excluded-packages" parameter ( issue 424 , thanks to alf.hogemark) [TODO update advanced user guide after release]
-
added: new parameter "authorized-users" for BASIC authentication with username and password to access the reports in the monitored webapp or in the optional collect server (revision 3890, revision 3914, thanks to Benjamin Durand). [TODO update user guide after release]
如果你想要 BASIC auth,但是不想要在 web.xml 使用一个 realm 和 "security-constraint" ,你可以在 web.xml 添加参数 "authorized-users" ,类似其他的 javamelody 参数。WEB-INF/web.xml 文件:
        <filter>
                <filter-name>monitoring</filter-name>
                <filter-class>net.bull.javamelody.MonitoringFilter</filter-class>
                <init-param>
                        <param-name>authorized-users</param-name>
                        <param-value>user1:pwd1, user2:pwd2</param-value>
                </init-param>
        </filter>
        ...
JavaMelody 能够监测Java或Java EE应用程序服务器,并以图表的方式显示:Java内存和Java CPU使用情况,用户Session数量,JDBC连接数,和http请求、sql请求、jsp页面与业务接口方法(EJB3、Spring、 Guice)的执行数量,平均执行时间,错误百分比等。图表可以按天,周,月,年或自定义时间段查看。
历史版本 :
JavaMelody 1.70.0 发布,Java 应用监控平台
JavaMelody 1.69.0 发布,Java 应用监控平台
JavaMelody 1.68.1 发布,Java 应用监控平台
JavaMelody 1.68.0 发布,Java 应用监控平台
JavaMelody v1.67.0 发布,系统监控平台
JavaMelody v1.66.0 发布,系统监控平台
JavaMelody v1.65.0 发布,系统监控平台
JavaMelody v1.64.0 发布,系统监控平台
JavaMelody v1.63.0 发布,系统监控平台
JavaMelody v1.62.0 发布,系统监控平台
JavaMelody v1.61.0 发布,系统监控平台
JavaMelody v1.60.0 发布,系统监控平台